
Omics based experiments generate highly complex datasets. Usually expression data of more than 4000 genes are recorded in replicates at different experimental conditions. Genes are assigned to cellular functions. Systems of cellular functions are hierarchically organized in several levels.
A suitable visualization of these data on one computer screen is a challenging task.
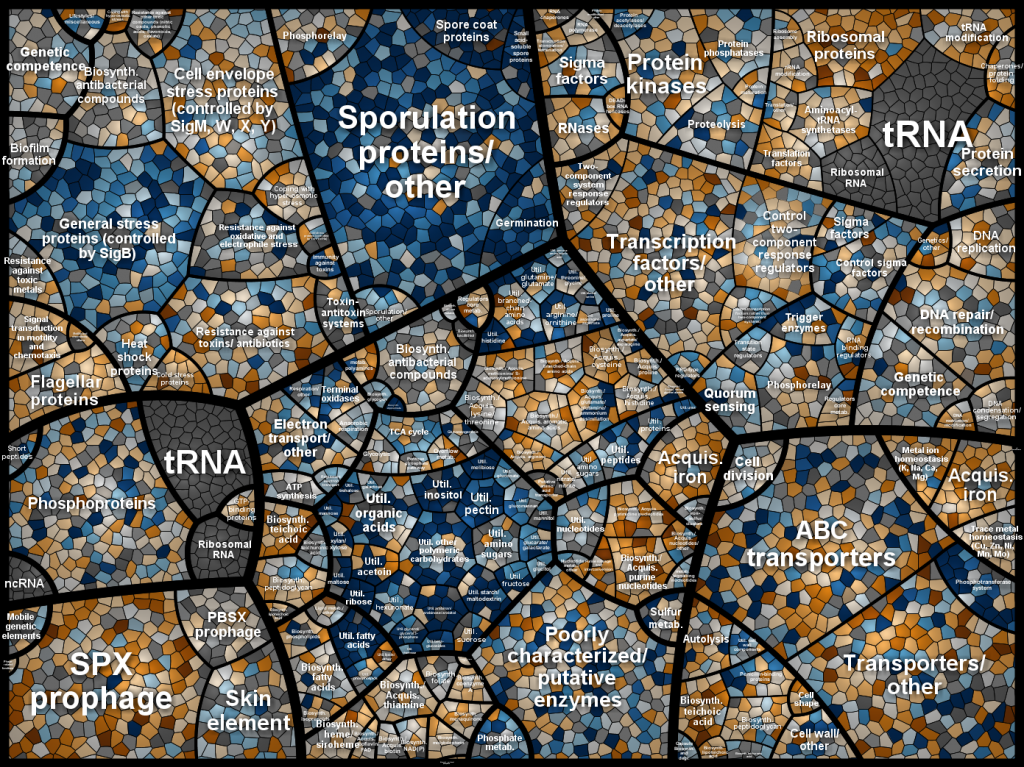
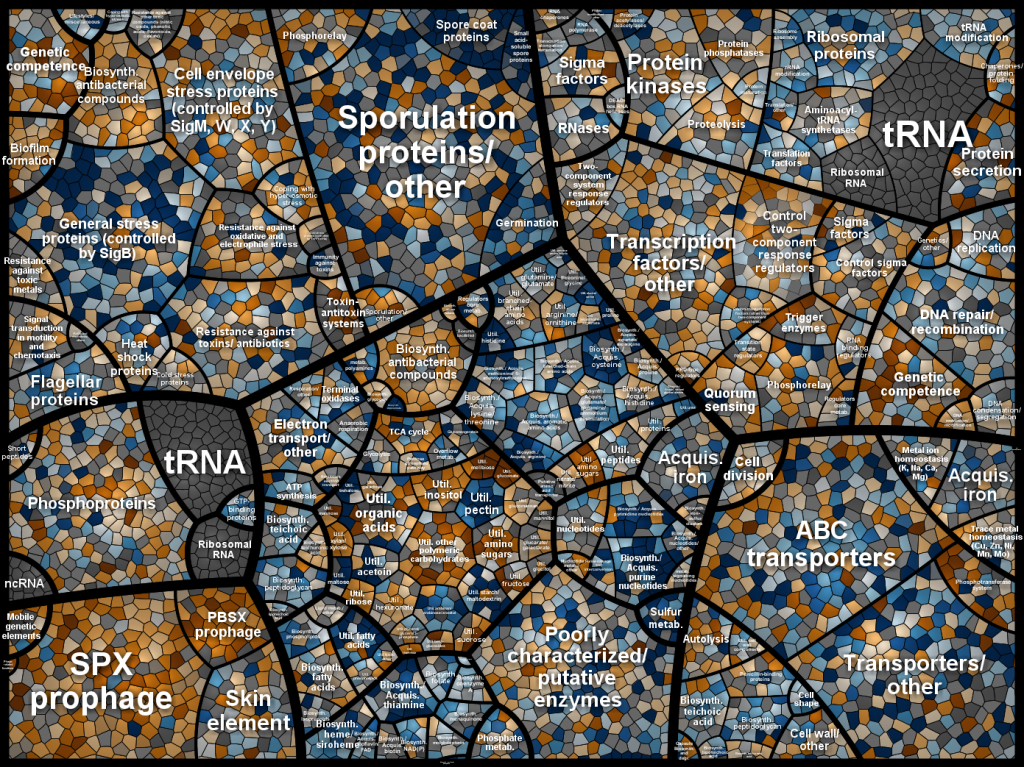
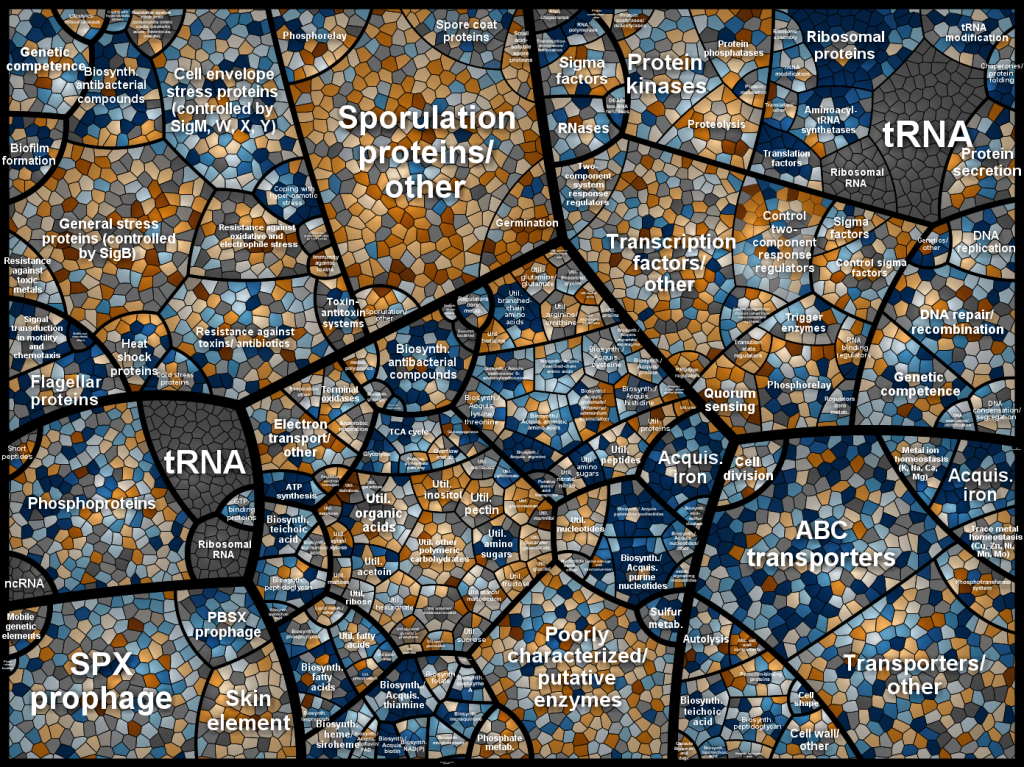
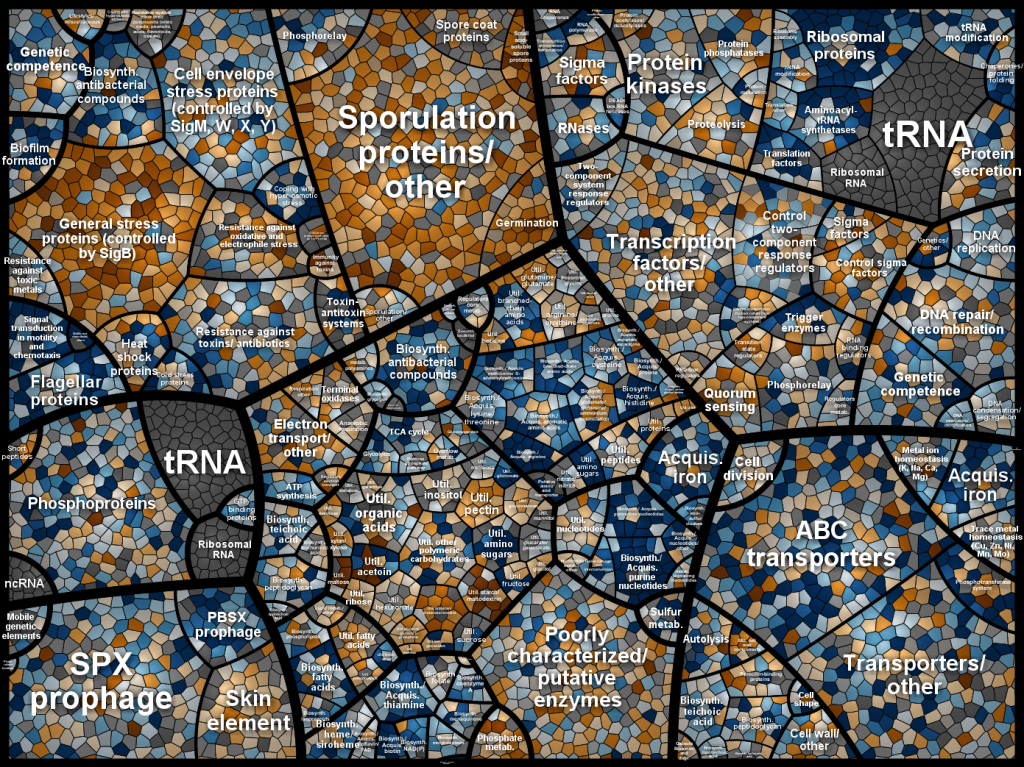
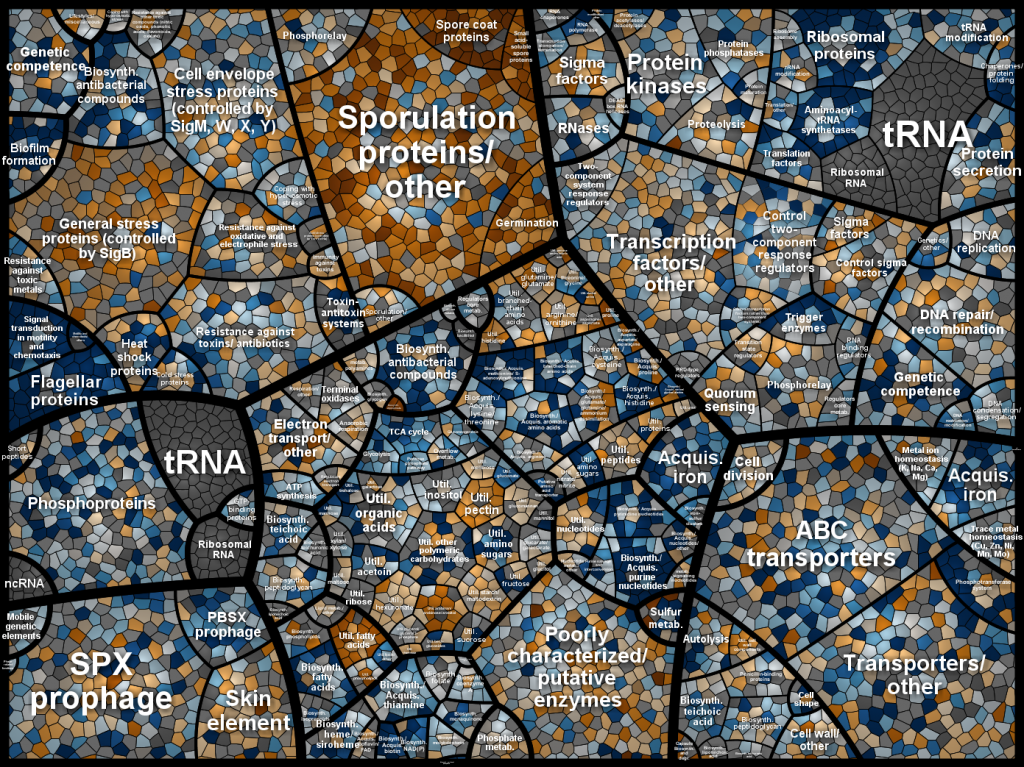
In the shown example all genes assigned to a hierarchy of cellular functions, the relative expression level at five different time points, and the data deviation information need to be displayed. For this purpose the gene functional assignments are encoded by a hierarchically structured treemap with tiles representing the genes at the deepest level, the expression is encoded by a two sided color gradient (blue – decrease; grey – median expression; orange – increase), the coefficient of variation by a color desaturation gradient and the time line by an animation.