
Traditional proteomics approaches such as 2D gel electrophoresis access intact protein molecules (see our wikipedia article). Because of their differing biochemical properties only a subset of all proteins can be accessed. Venn or Euler diagrams are suitable visualization tools to compare protein sets which were isolated by different extraction protocols or from different samples. Such charts comparing differnt sets summarize the coverage information but mask the data on the recovery of individual entities.
In modern gelfree proteomics data are recorded on peptide level. For this purpose proteins are site specifically cleaved by using proteolytic enzymes such as trypsin, chymotrypsin and others. For each protein a set of peptides with varying biochemical properties will be generated. Hierachically structured treemaps may complement set based data displays if the individual information on peptide level is of interest. They present the peptides as a sublevel of the protein nodes and answer the question which peptides belonging to which protein have been accessed.
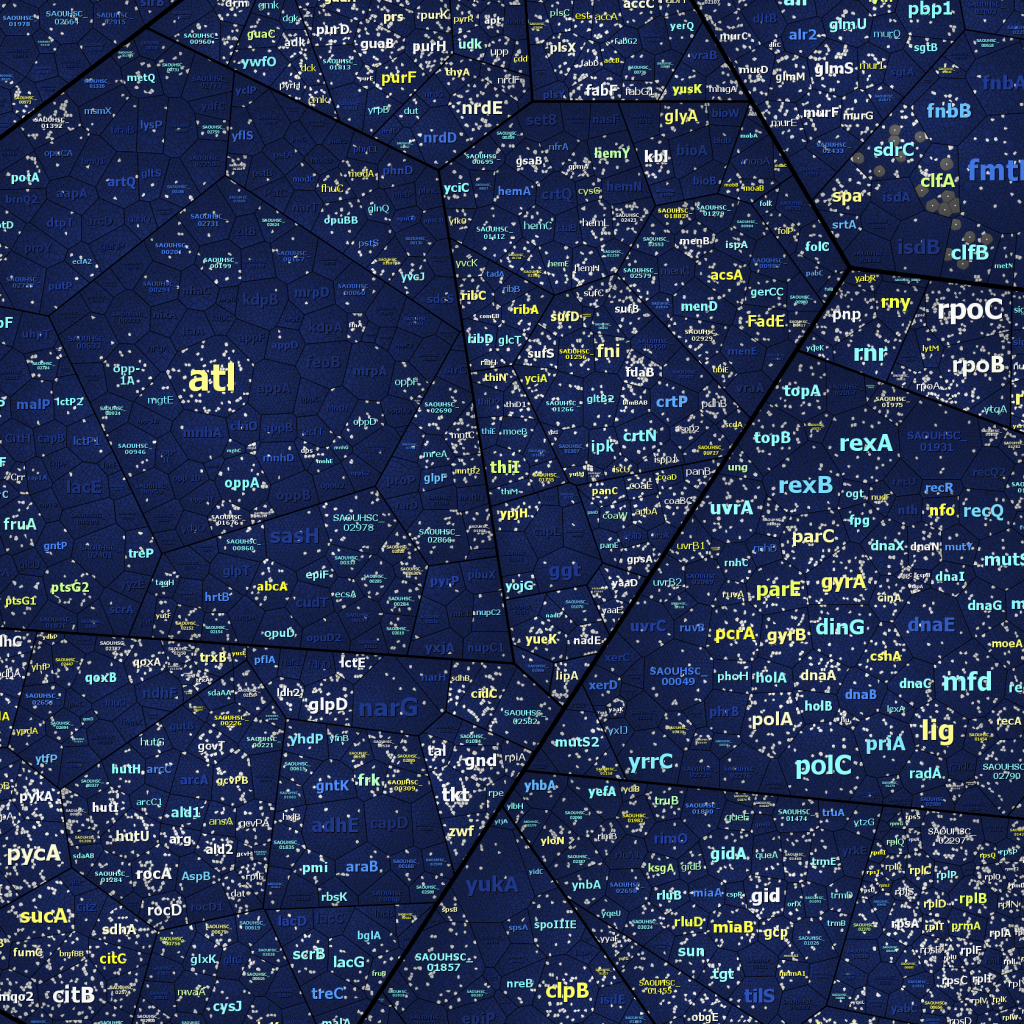
The figure (click it to enlarge) shows the proteomic coverage on peptide level of a S. aureus bacterial sample by using a Voronoi treemap. Recovered peptides are shown in white color, theoretically possible but non accessed peptides in dark blue. The protein cell size corresponds to the amount of peptides belonging to this protein. The label color results from the different proteins sequence coverage on peptide level. The lighter the label, the more sequence coverage was observed (dark blue – no coverage via light blue, cyan, greenish cyan, yellow to white – >35% coverage).