
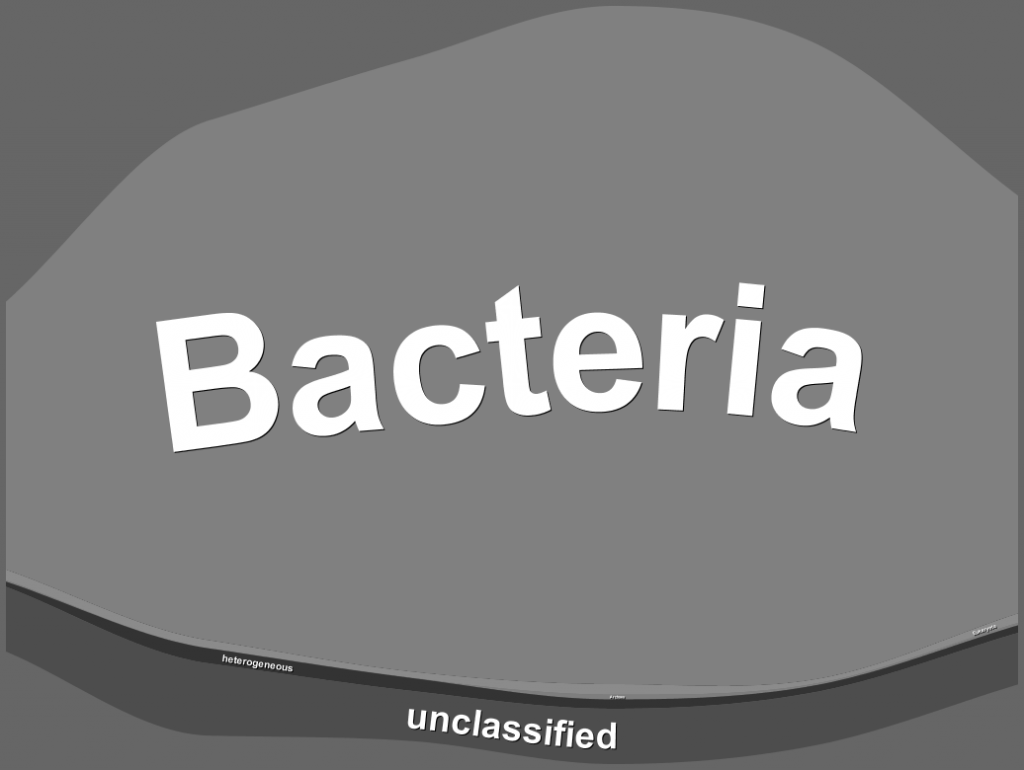
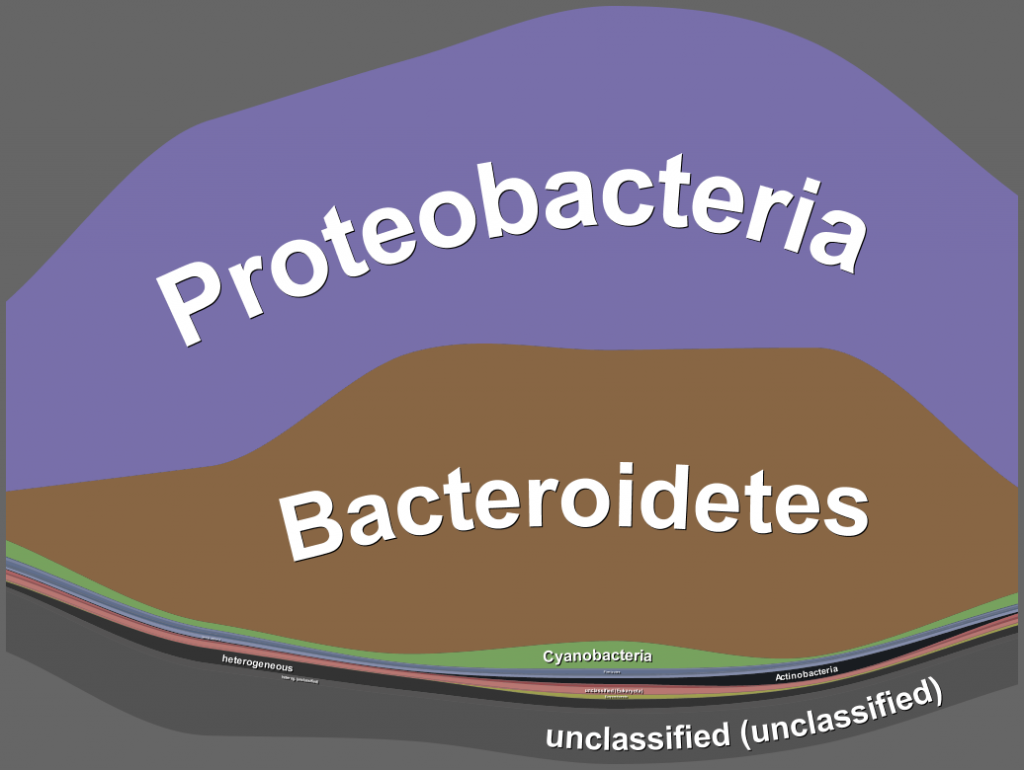
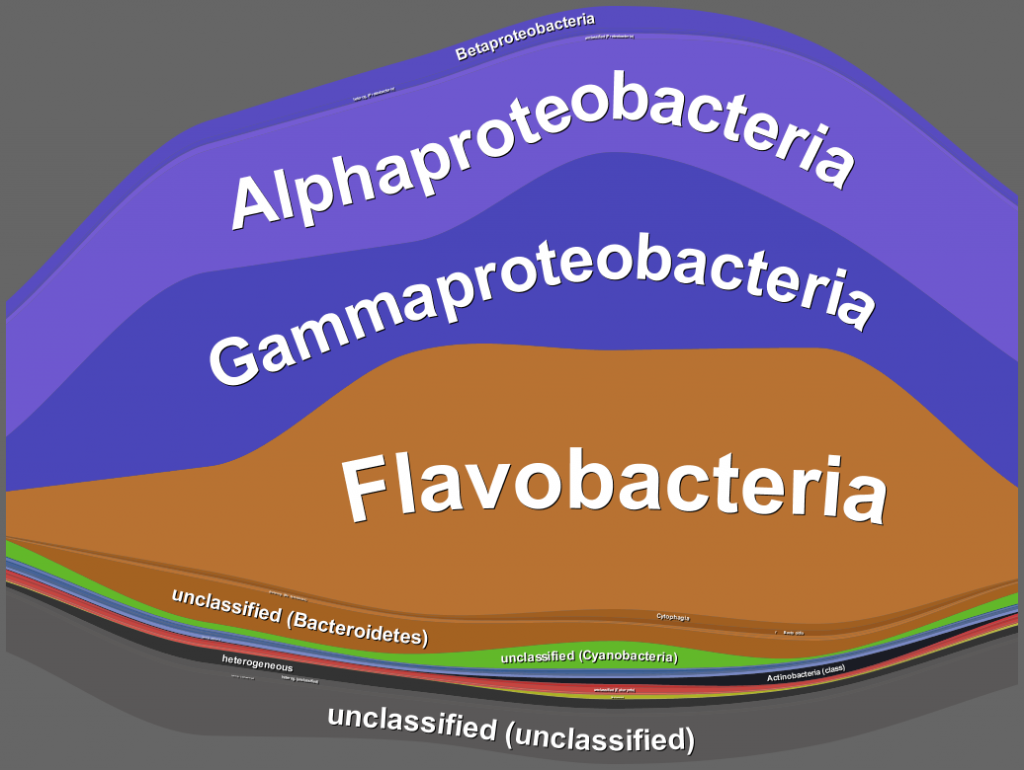
Environmental samples contain complex bacterial communities those composition is affected by fluctuations of different factors such as availability of nutrients, temperature and others. This is illustrated on proteomic level for a marine sample set at a free water sampling point, North Sea in spring 2009.
Protein spectral abundance data are encoded by the height of the shown data ribbons. Phylogenetically related taxa are encoded by similar colors. Because the human perceptual system is not able to efficiently process more than six colors at the same time we developed a text labeling approach that uses the heighest part of the data ribbon with minimal changes in slope for placing the text labels and enabling easy readability.

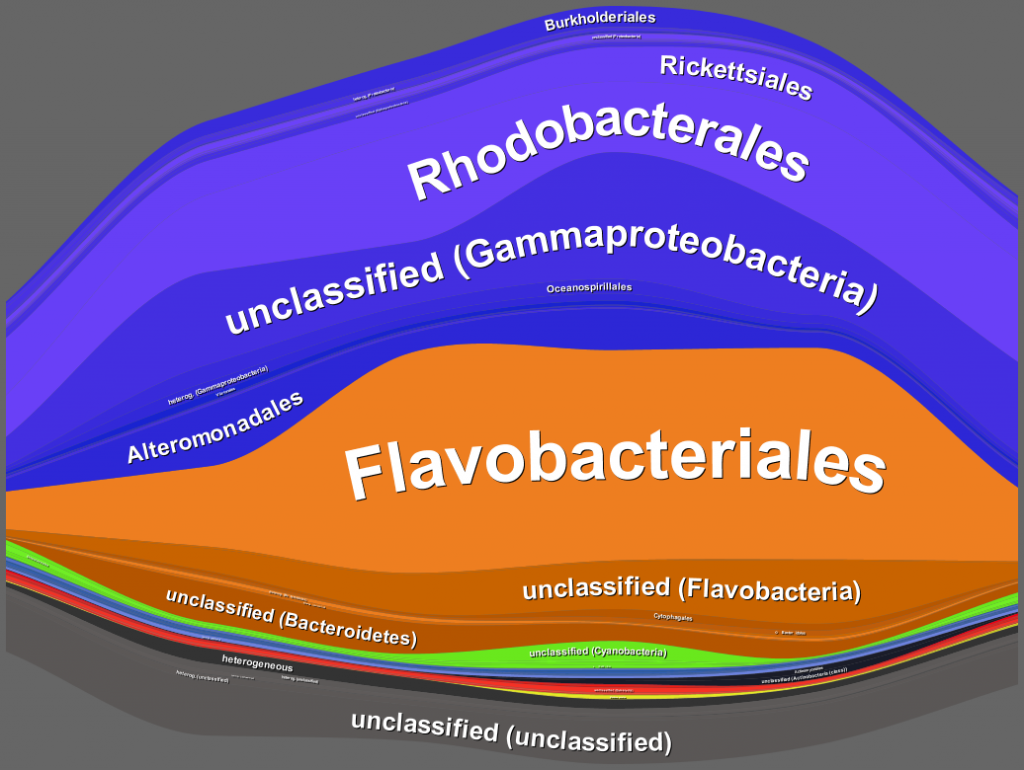
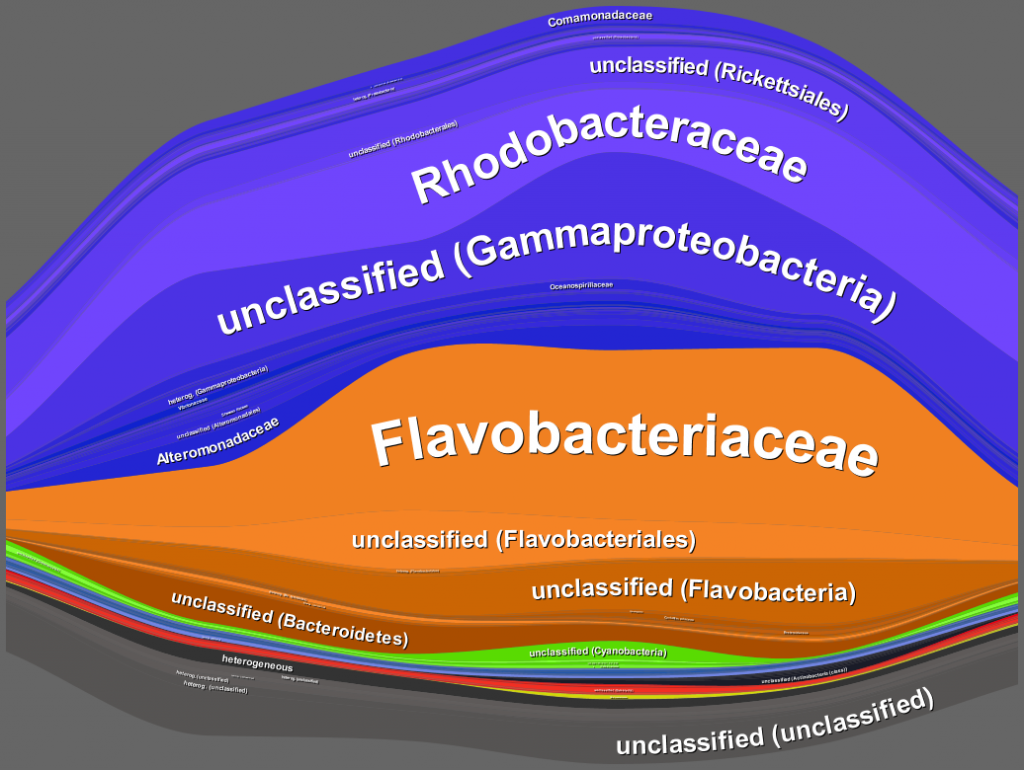
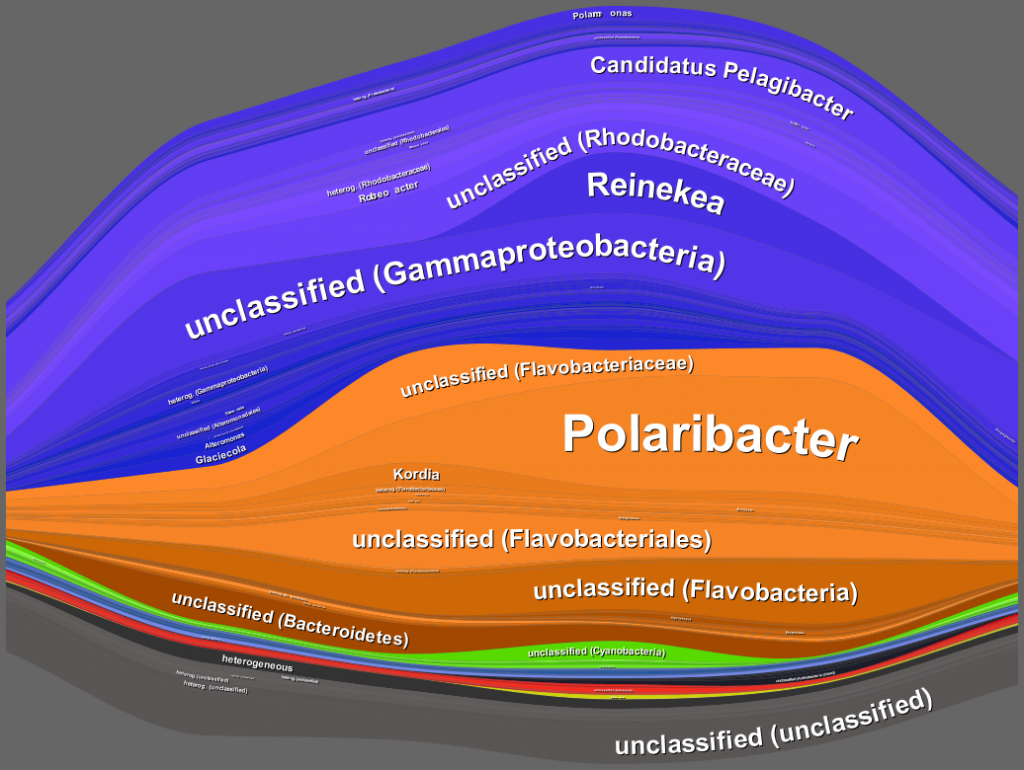
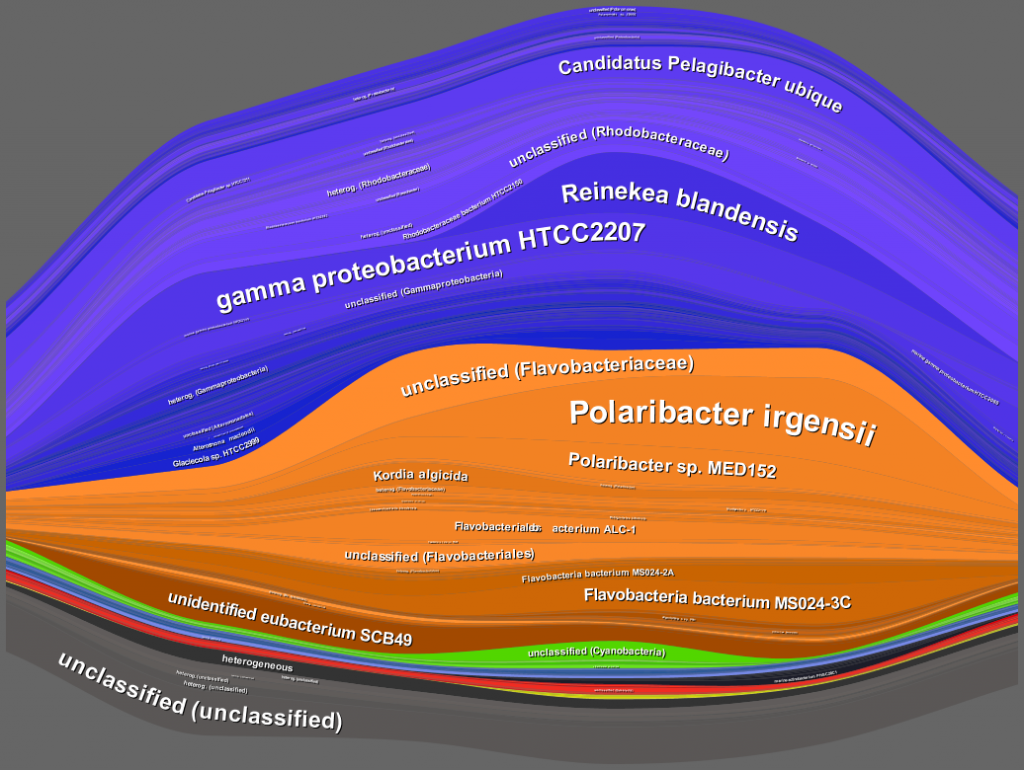
The shown stream graphs can be also applied to visualize the composition of bacterial communities for concentration or spatial profiles such as in depth profiles within the water column, in sediments, the soil, in zones of changing oxygen supply etc pp.